Modern web design requires more than aesthetic appeal. Reactive web design principles enable designers and developers to make informed decisions based on real user behavior. Data-driven approaches transform subjective design choices into measurable improvements that enhance user experience and business outcomes.
Understanding how reactive design supports data collection and analysis empowers teams to create interfaces that adapt and improve continuously. This guide explores the connection between reactive design patterns and data-driven decision-making for superior user interfaces.
Understanding Reactive Web Design Principles
Reactive web design responds dynamically to user interactions and device capabilities. Unlike static layouts, reactive systems adjust elements based on real-time conditions. These systems monitor user behavior, device specifications, and performance metrics continuously.
The reactive approach differs from traditional responsive design. Responsive design adapts layouts to screen sizes using CSS media queries. However, reactive design goes further by incorporating JavaScript frameworks that respond to user actions instantly.
Reactive frameworks like React, Vue, and Angular enable component-based architectures. Components update independently when data changes, creating seamless user experiences. Therefore, developers can track which components users engage with most frequently.
Event-driven architecture forms the foundation of reactive design. Every user interaction triggers events that systems capture and analyze. Additionally, these events provide valuable data about user preferences and pain points.
Collecting User Interaction Data Through Reactive Components
Reactive components naturally generate rich interaction data. Each click, scroll, hover, and form input creates trackable events. Modern frameworks make capturing these events straightforward through built-in event handlers.
Component lifecycle methods provide insights into rendering performance and user engagement. Developers can measure how long components remain visible on screen. Moreover, tracking component mount and unmount patterns reveals user navigation preferences.
State management systems like Redux or Vuex centralize application data flow. These systems create comprehensive logs of every state change throughout user sessions. Consequently, teams can reconstruct entire user journeys for analysis.
Custom event tracking integrates seamlessly with reactive architectures. Developers implement analytics without disrupting user experience or component functionality. However, careful planning ensures tracking remains lightweight and doesn’t affect performance.
Measuring User Engagement With Real-Time Analytics
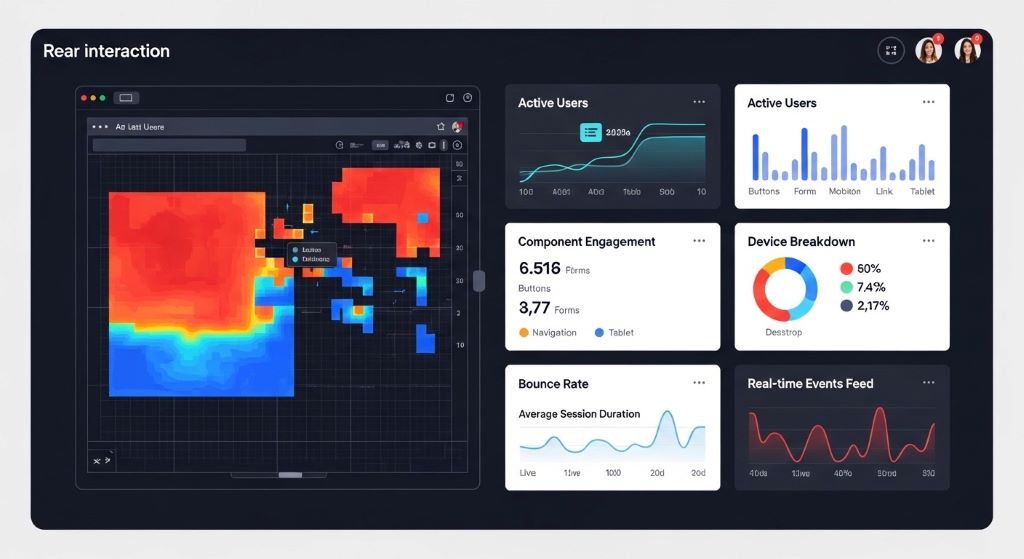
Real-time analytics dashboards display user behavior as it happens. Reactive design enables instant feedback about which features users find valuable. Teams can identify popular components and struggling interface elements immediately.
Heat mapping tools visualize where users click, scroll, and focus attention. Reactive frameworks facilitate accurate heat map generation through precise event tracking. Additionally, scroll depth metrics reveal whether users consume content fully or abandon pages prematurely.
Session recording captures actual user experiences including frustrations and confusion points. Watching recordings reveals usability issues that quantitative data might miss. Therefore, combining session recordings with metric analysis provides complete understanding.
Engagement metrics like time on page, bounce rate, and interaction depth become more meaningful with reactive tracking. Granular component-level data shows exactly where engagement increases or decreases. Moreover, A/B testing reactive components yields faster, more reliable results.
Optimizing Performance Through Data Insights
Performance metrics directly impact user satisfaction and conversion rates. Reactive design patterns enable detailed performance monitoring at component levels. Teams identify which components slow page loads or cause rendering delays.
Component rendering times reveal optimization opportunities. Measuring virtual DOM updates helps developers minimize unnecessary re-renders. Additionally, lazy loading strategies can prioritize critical components based on usage data.
Network request patterns emerge from reactive application monitoring. Teams discover which API calls happen most frequently and where caching might help. Therefore, data-driven performance improvements target actual bottlenecks rather than assumptions.
Core Web Vitals measurements integrate naturally with reactive architectures. Largest Contentful Paint, First Input Delay, and Cumulative Layout Shift metrics guide optimization priorities. However, component-level granularity provides more actionable insights than page-level metrics alone.
According to Google’s Web Fundamentals, performance directly affects user engagement, with every 100ms delay potentially decreasing conversion rates by one percent or more.
Personalizing User Experiences With Behavioral Data
Reactive systems adapt interfaces based on individual user behavior patterns. Machine learning algorithms analyze collected data to predict user preferences. Consequently, interfaces can display personalized content and navigation options automatically.
User preference data flows through reactive state management systems. Components respond to preference changes instantly without page reloads. Moreover, personalization happens seamlessly without interrupting user workflow.
Progressive profiling builds user understanding over time through reactive data collection. Instead of lengthy initial forms, systems gather information gradually through interaction patterns. Additionally, this approach reduces form abandonment while increasing data quality.
Contextual interfaces adjust based on user history and current behavior. Frequent features become more accessible while rarely used options move to secondary positions. Therefore, each user experiences an interface optimized for their specific needs.

Supporting A/B Testing and Experimentation
Reactive architecture simplifies implementing and managing A/B tests. Component-based design allows testing individual elements without affecting entire pages. Teams can experiment with multiple variations simultaneously across different user segments.
Feature flags integrate naturally with reactive state management. Developers deploy multiple component versions and toggle them based on user segments. Additionally, gradual rollouts reduce risk when introducing significant interface changes.
Multivariate testing becomes manageable through reactive component systems. Testing multiple elements simultaneously reveals interaction effects between components. However, proper statistical analysis remains essential for drawing valid conclusions.
Real-time results monitoring enables rapid iteration cycles. Teams can pause underperforming tests quickly or scale successful variations immediately. Therefore, reactive design accelerates the experimentation process significantly.
Identifying Usability Issues From Interaction Patterns
Rage clicks indicate user frustration when elements don’t respond as expected. Reactive event tracking identifies these patterns automatically, flagging potential usability problems. Teams can investigate and resolve issues before they affect more users.
Error boundary data reveals where users encounter technical problems. Reactive frameworks capture component errors and their contexts. Moreover, correlating errors with specific user actions helps reproduce and fix bugs efficiently.
Form abandonment analysis shows exactly where users give up during input processes. Field-level tracking identifies problematic questions or confusing interfaces. Additionally, this data guides form simplification and improvement efforts.
Navigation confusion patterns emerge from analyzing back button usage and repeated page visits. Users who repeatedly return to the same pages likely struggle finding desired information. Therefore, improving navigation based on these patterns enhances overall usability.
Making Informed Layout and Design Decisions
Viewport size distributions inform responsive breakpoint decisions. Rather than using arbitrary breakpoints, teams can choose values matching actual user devices. Consequently, layouts work optimally for the highest percentage of real users.
Component usage frequency data prioritizes design attention appropriately. Heavily used components deserve more refinement than rarely accessed features. Additionally, this prevents wasting resources perfecting elements few users see.
Visual hierarchy validation comes from attention tracking data. Heat maps confirm whether users notice important elements or miss critical information. Therefore, designs can emphasize elements that data shows users overlook.
Color scheme effectiveness becomes measurable through conversion tracking. Different color variations can affect button click rates and form completions. However, cultural and accessibility considerations remain important alongside pure metrics.
According to Smashing Magazine, data-driven accessibility improvements benefit all users by creating clearer, more intuitive interfaces beyond legal compliance requirements.
Integrating Analytics Tools With Reactive Frameworks
Google Analytics 4 integrates seamlessly with reactive applications through event-based tracking. Custom events map directly to component interactions. Teams gain consistent tracking across single-page applications without page reload complications.
Segment.io provides unified analytics infrastructure for reactive applications. One integration supports multiple analytics platforms simultaneously. Moreover, centralized event definitions ensure consistency across tools.
Mixpanel and Amplitude specialize in product analytics for reactive applications. These platforms offer funnel analysis, cohort studies, and retention tracking. Additionally, they provide user-level insights rather than just session-level data.
Custom analytics solutions leverage reactive framework capabilities directly. Teams build exactly the tracking they need without third-party limitations. However, building custom solutions requires significant development resources and maintenance.
Establishing Data-Driven Design Workflows
Data democratization ensures entire teams access relevant metrics. Designers, developers, and product managers all need data visibility. Therefore, establishing shared dashboards prevents information silos.
Regular data review sessions align teams around user needs and business goals. Weekly or bi-weekly meetings discuss recent findings and upcoming experiments. Additionally, these sessions prioritize design improvements based on impact potential.
Documentation of decision rationale creates institutional knowledge. Recording why specific design choices were made based on data helps future team members. Moreover, this prevents repeating failed experiments or questioning successful patterns.
Balancing quantitative data with qualitative insights prevents over-optimization. Numbers show what happens but not always why it happens. Therefore, combining analytics with user interviews and usability testing provides complete understanding.
Ensuring Privacy and Ethical Data Collection
Transparent data collection builds user trust. Clear privacy policies explain what data is collected and how it’s used. Additionally, providing opt-out mechanisms respects user preferences regarding tracking.
Data minimization principles limit collection to necessary information only. Collecting excessive data creates privacy risks without adding value. Therefore, carefully consider what metrics actually inform design decisions.
Anonymization protects individual user privacy while preserving analytical value. Aggregate data patterns reveal insights without exposing personal information. Moreover, proper anonymization complies with regulations like GDPR and CCPA.
Security measures protect collected data from breaches and unauthorized access. Encryption, access controls, and regular audits maintain data integrity. However, the best security starts with collecting only essential information.
Measuring Business Impact of Data-Driven Design Changes
Conversion rate improvements directly tie to business outcomes. Tracking how design changes affect conversions justifies design investments. Teams can calculate return on investment for specific optimization efforts.
Revenue per visitor metrics connect user experience to financial performance. Improving interfaces that increase this metric generates clear business value. Additionally, this helps prioritize which areas of applications to optimize first.
Customer lifetime value often increases with better user experiences. Reducing friction and frustration improves retention and repeat purchases. Therefore, long-term metrics matter as much as immediate conversion rates.
Cost reduction through efficiency gains represents significant business impact. Interfaces requiring fewer support tickets or training resources save operational expenses. Moreover, self-service improvements reduce customer service demands.
Scaling Data-Driven Design Across Teams
Design systems codify successful patterns discovered through data analysis. Reusable components spread proven solutions across applications. Teams avoid reinventing solutions to already-solved problems.
Cross-functional collaboration ensures data reaches all relevant decision-makers. Designers need access to performance metrics while developers need usability insights. Therefore, breaking down data silos accelerates improvement cycles.
Training programs help team members interpret and apply data correctly. Understanding statistical significance prevents false conclusions from random variations. Additionally, training in analytics tools empowers more team members to explore data independently.
Automation reduces manual data analysis burden. Automated reports highlight significant changes requiring attention. However, human judgment remains essential for interpreting context and making final decisions.
Conclusion
Reactive web design and data-driven decision-making form a powerful combination for creating superior user interfaces. Reactive architectures naturally generate rich interaction data while enabling rapid experimentation and personalization. Teams leveraging this connection make informed decisions based on actual user behavior rather than assumptions. Therefore, interfaces continuously improve through measurable iterations guided by real-world usage patterns. The integration of reactive design principles with comprehensive analytics creates a foundation for building user experiences that truly serve audience needs while achieving business objectives. Success requires combining technical implementation with ethical data practices and cross-functional collaboration.
Frequently Asked Questions
What is the difference between reactive and responsive web design?
Responsive design adapts layouts to different screen sizes using CSS media queries. Reactive design goes further by dynamically responding to user interactions and application state changes in real-time using JavaScript frameworks. Reactive systems collect richer data about user behavior.
How does reactive design improve data collection compared to traditional websites?
Reactive frameworks track component-level interactions with precise event handling and state management. This provides granular data about which interface elements users engage with most. Traditional websites typically only track page-level metrics missing important interaction details.
What tools work best for analyzing data from reactive web applications?
Google Analytics 4, Mixpanel, Amplitude, and Segment.io integrate well with reactive frameworks. These tools handle single-page application tracking and provide event-based analytics. Additionally, heat mapping tools like Hotjar complement quantitative data with visual insights.
Can small teams without data scientists benefit from data-driven reactive design?
Yes, modern analytics platforms make data analysis accessible without specialized expertise. Starting with basic metrics like conversion rates, bounce rates, and user flows provides immediate value. Teams can implement simple A/B tests and gradually increase analytical sophistication over time.
How do you balance user privacy with collecting data for design decisions?
Collect only essential data needed for specific design questions. Implement proper anonymization, provide clear opt-out options, and maintain transparent privacy policies. Focus on aggregate patterns rather than individual user tracking whenever possible to respect privacy while gaining insights.
Related Topics: